When writing services in Rust I’ve always aimed for zero panics in production. Aside from
general correctness and code quality this also improves the API quality - our user should
always expect a response from a HTTP endpoint with a meaningful status code and body when
there’s an error. But sometimes things go awry and your service has a panic that it hits
in production. This post is a small trick I’ve made use of to make sure you can catch
those panics and make fixing them easier, setting a custom panic hook with
set_hook.
The default panic hook will look similar to this, printing out the error and optionally a backtrace if it was captured:
use std::{
    backtrace::{Backtrace, BacktraceStatus},
    io::{self, Write},
    panic::{self, PanicHookInfo},
    thread,
};

fn default_like_hook(info: &PanicHookInfo<'_>) {
    let thread = thread::current();
    let name = thread.name().unwrap_or("<unnamed>");

    let message = match info.payload().downcast_ref::<&str>() {
        Some(message) => *message,
        None => match info.payload().downcast_ref::<String>() {
            Some(message) => message.as_str(),
            None => "Box<dyn Any>",
        },
    };

    let mut stderr = io::stderr().lock();

    // Avoid another panic if writing to stderr fails.
    if let Some(location) = info.location() {
        let _ = writeln!(
            stderr,
            "\nthread '{name}' panicked at {location}:\n{message}"
        );
    } else {
        let _ = writeln!(stderr, "\nthread '{name}' panicked:\n{message}");
    }

    let backtrace = Backtrace::capture();
    if backtrace.status() == BacktraceStatus::Captured {
        let _ = writeln!(stderr, "stack backtrace:\n{backtrace}");
    }
}
This is okay, but it’s not so good for web services. Especially if you have thousands of requests coming in at once you want to be able to link the panic to the request. And backtraces don’t come with semantic information about the request that can help you diagnose the panic. With this in mind we have a few requirements for our new panic hook:
- I want to see the panic in the Opentelemetry traces
- I want to be alerted when a panic happens
- I want to know how many panics are happening
Like many people I’m using Axum, Tracing and Metrics crates, I won’t quite set up the metrics handler as it’s a bit out of scope. But I will setup Opentelemetry in the example using the some of the tracing-opentelemetry-instrumentation-sdk crates as general “good” defaults. But without further ado here is all the code alongside a handler that will only panic:
use axum::{Router, routing::get};
use axum_tracing_opentelemetry::middleware::{OtelAxumLayer, OtelInResponseLayer};
use std::panic::{PanicHookInfo, set_hook};
use tracing::{error, error_span};

fn traced_panic_hook(info: &PanicHookInfo) {
    metrics::counter!("service_panics").increment(1);
    let location = info.location();

    let msg = match info.payload().downcast_ref::<&'static str>() {
        Some(s) => *s,
        None => match info.payload().downcast_ref::<String>() {
            Some(s) => &s[..],
            None => "Box<dyn Any>",
        },
    };

    let thread = std::thread::current();
    let thread = thread.name().unwrap_or("<unnamed>");
    let backtrace = std::backtrace::Backtrace::capture();

    let _entered = if let Some(location) = location {
        error_span!("panic", %thread, location = %format!("{}:{}:{}", location.file(), location.line(), location.column()))
    } else {
        // very unlikely to hit here, but the guarantees of std could change
        error_span!("panic", %thread)
    }
    .entered();

    if backtrace.status() == std::backtrace::BacktraceStatus::Captured {
        error!(backtrace=%backtrace, "{msg}");
    } else {
        error!("{msg}");
    }
}

#[tokio::main]
async fn main() {
    let _guard = init_tracing_opentelemetry::TracingConfig::default()
        .with_json_format()
        .with_stderr()
        .with_log_directives("debug")
        .init_subscriber()
        .expect("Failed to setup otel");

    set_hook(Box::new(traced_panic_hook));

    let app = Router::new()
        .route("/", get(handler))
        .layer(OtelInResponseLayer)
        .layer(OtelAxumLayer::default());

    let listener = tokio::net::TcpListener::bind("127.0.0.1:3000")
        .await
        .unwrap();

    axum::serve(listener, app).await.unwrap();
}

async fn handler() -> String {
    unimplemented!("Oh no");
}
Here we increment a metric tracking all panics, create an Opentelemetry span and we log
the panic message and the backtrace if captured. For testing things with Opentelemetry
I typically use Jaeger via a Docker container. This can be launched via docker run --rm -p "16686:16686" -p "4317:4317" jaegertracing/all-in-one:1.57.0.
Then setting the following environment variables we can start our code and make
some GET requests to http://localhost:3000/.
OTEL_EXPORTER_OTLP_ENDPOINT=http://localhost:4317
OTEL_EXPORTER_OTLP_PROTOCOL=grpc
OTEL_SERVICE_NAME=panic_gottem
RUST_BACKTRACE=1
We can also change RUST_BACKTRACE to 0 to disable it for testing both paths.
Now time for a screenshot:
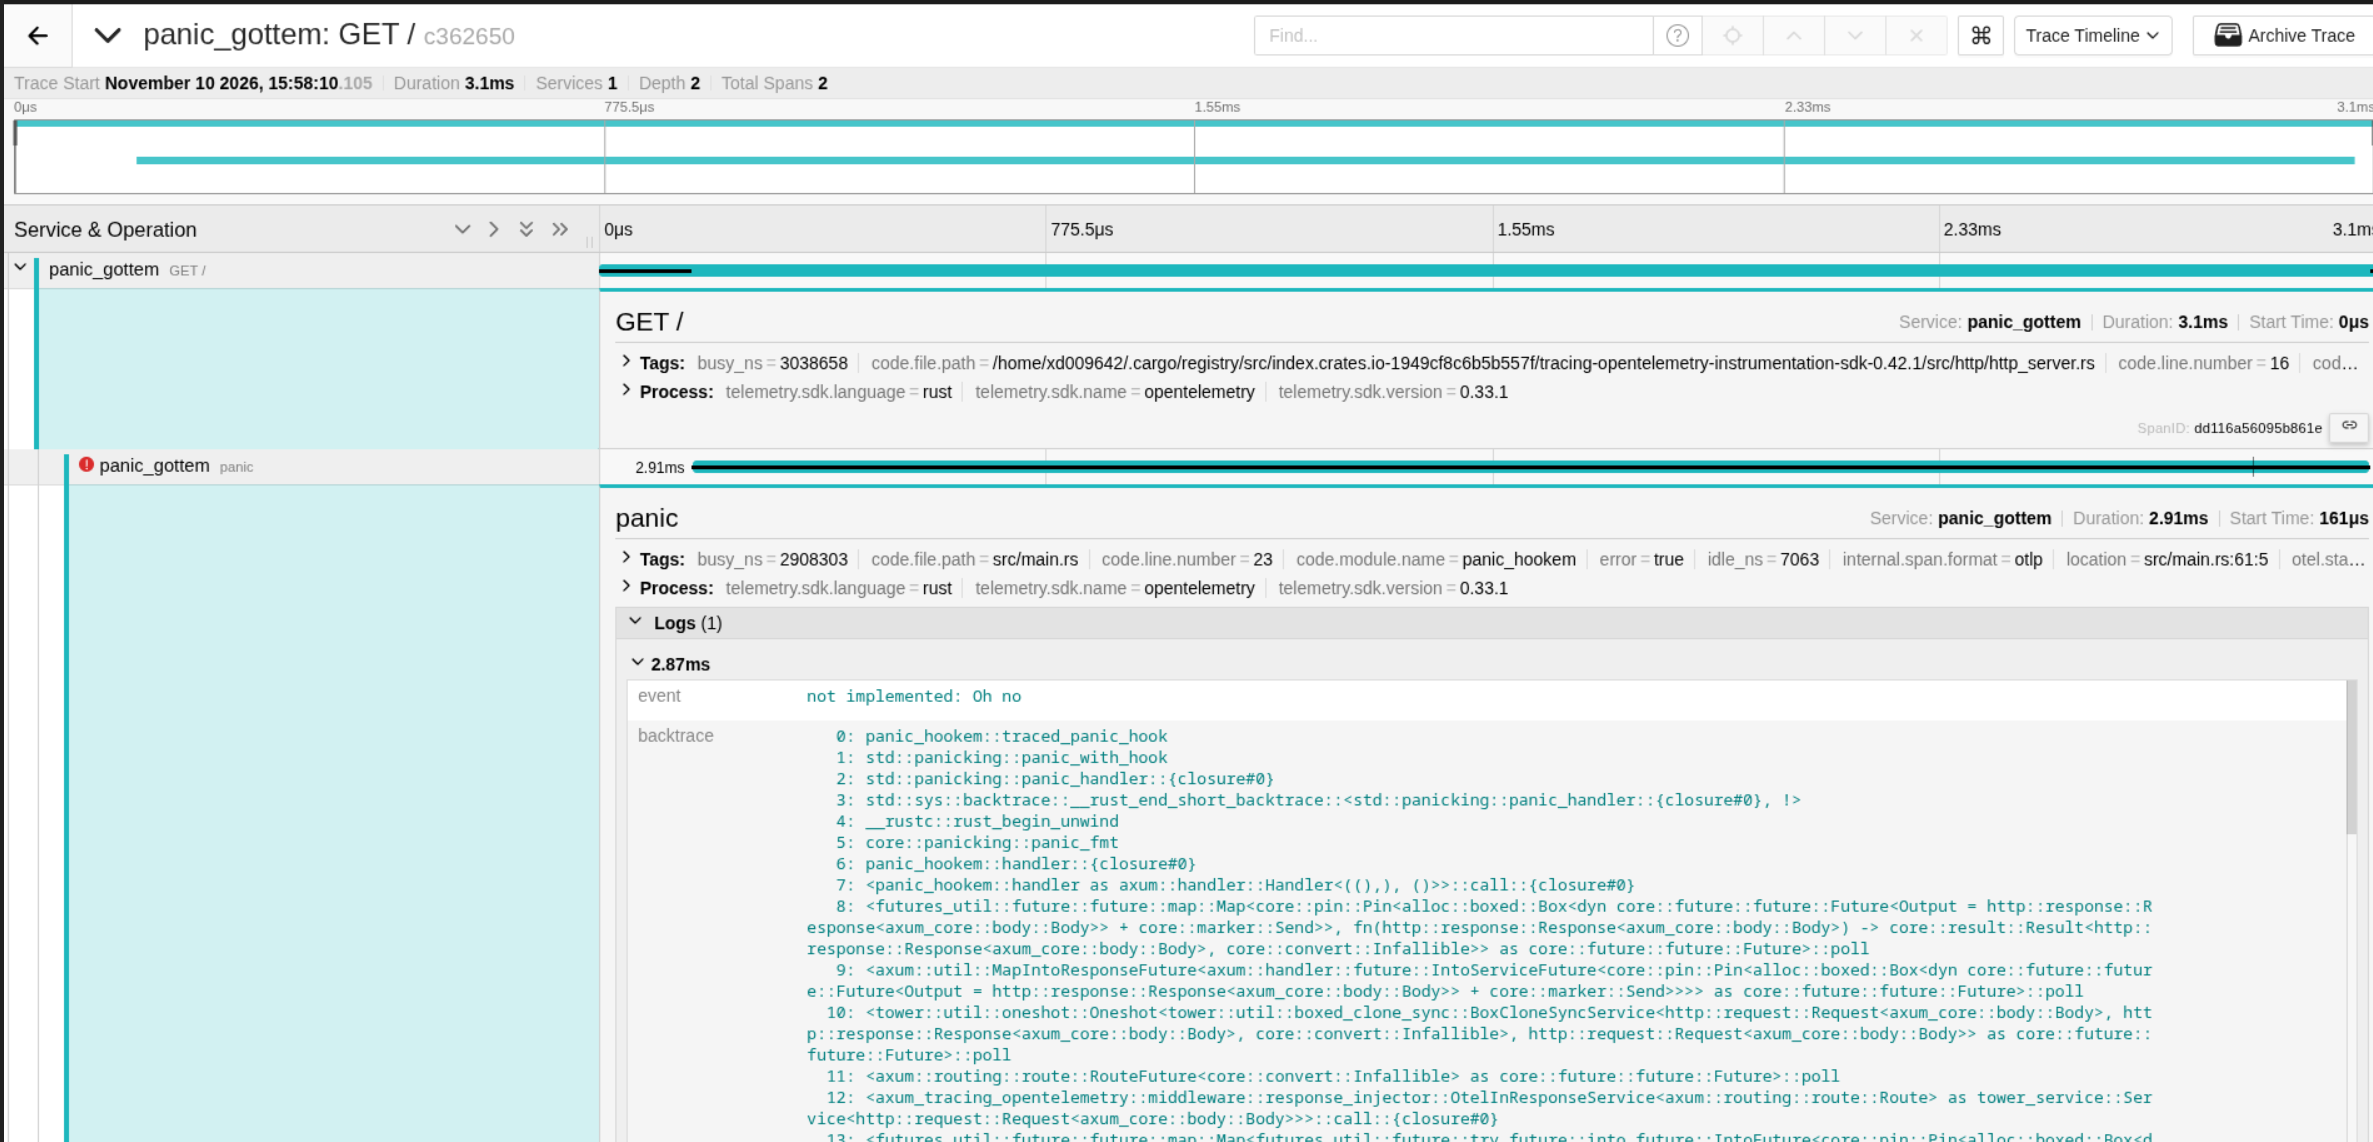
With the backtrace enabled it will look exactly the same, minus the backtrace field on the event. It is worth noting that with backtraces disabled the handler normally takes about 100-200μs on my machine, with backtraces enabled it’s more like 3-4ms.
With all this done, the only thing I haven’t really solved here is making sure
people’s usage of tokio::task::spawn(_blocking) doesn’t lead to new root spans.
For that we use a clippy lint and force people working on the project to use
a spawn wrapper that makes sure the spans are parented properly. Another thing
to use is catch_unwind in the handlers to ensure any panics are caught and
return a proper error response. Something like so:
async fn handler() -> String {
    match std::panic::catch_unwind(|| unimplemented!("ohno")) {
        Ok(s) => s,
        Err(e) => format!("Something went wrong :("),
    }
}
I haven’t actually ended up using catch_unwind, mainly because a lot
of my work services spawn longer-running tasks anyway for blocking work. But
this is something that can make sure a user never gets an empty API response and
helps you track down and get rid of those panics for good.
All code can be found here.