You might want to read the previous post.
This post is going to be much the same stuff, while skipping going over
things I talked about before. And with some changes in approach, and
different tools than perf and cargo flamegraph!
New Tools!
Firstly, now that polars doesn’t take 40 minutes for a tarpaulin run, I’ll be using hyperfine to get some statistics on the tarpaulin runs.
And from the comments of the last post from /u/Shnatsel:
For profiling I’ve moved away from perf + flamegraphs to https://crates.io/crates/samply, which provides the same flamegraphs plus much more, and you even get to share your results to anyone with a web browser in just two clicks. It’s also portable to mac and windows, not just linux. It has become my go-to tool for profiling and I cannot recommend it enough.
Strong praise indeed, so I’m finally giving it a try!
The First Win
Using samply I saw that HashMap::get in generate_subreport was taking
most of the time in report generation now. This time I ran it on the
llvm-profparsers CLI tool instead of tarpaulin on some files I had lying
around from another project I was testing. At this point I was mainly seeing if
samply worked.
Running samply was as simple as:
samply record target/release/cov show --instr-profile benches/data/mapping/profraws/* --object benches/data/mapping/binaries/*Now this code does go over the region expressions and generate count values and add to a list of pending expressions. You can see the full function at this point in time here. But it’s long so I won’t paste it all in but instead explain a bit.
There is a map of region IDs to counts and as we go over the expression list, we
get elements from the initial version and update values as we resolve expressions.
The HashMap::get calls happen in loops as we go over the expression tree.
Initially, we do one pass through to build up the pending expressions and then loop over the pending list until we finish it. Reducing the number of times we loop over things should speed things up.
I noticed previously that the pending expressions are represented by a flattened tree, which means the deeper nodes are located at indices further into the list. This means that, potentially, we can iterate over the list fewer times if we iterate over it in reverse first. Processing those deeper nodes first will mean that the nodes above them in the tree structure will get resolved quicker.
With that in mind I did the following diff:
< for (expr_index, expr) in func.expressions.iter().enumerate()
---
> for (expr_index, expr) in func.expressions.iter().enumerate().rev()
Running the benchmark and…
Benchmarking report generation: Warming up for 3.0000 s
Warning: Unable to complete 100 samples in 5.0s.
report generation       time:   [806.43 ms 809.27 ms 812.17 ms]
                        change: [-79.923% -79.433% -78.921%] (p = 0.00 < 0.05)
                        Performance has improved.

Benchmarking subreport generation: Warming up for 3.0000 s
Warning: Unable to complete 100 samples in 5.0s.
subreport generation    time:   [117.87 ms 119.28 ms 120.84 ms]
                        change: [-22.306% -21.266% -20.132%] (p = 0.00 < 0.05)
                        Performance has improved.
Found 13 outliers among 100 measurements (13.00%)
  9 (9.00%) high mild
  4 (4.00%) high severe
This takes report generation from ~3.8s to ~0.8s. I also noticed in report
generation there was a HashMap where I could reserve the additional capacity
and maybe save some allocations. Running samply again I see the part of the code
taking the most time is now the profraw parsing not report generation!
Oh dear glancing briefly at the report parsing I see:
let name = symtab.names.get(&data.name_ref).cloned();
let (hash, name_hash) = if symtab.contains(data.name_ref) {
    // SNIP
};
That can just be a if name.is_some() and avoid another HashMap lookup.
When I compared this parsing code to llvm, my initial implementation was significantly
faster. With the difficulties in the coverage mapping part of the code and then its
performance issues, I didn’t really go back and see if I could speed up the profraw
parsing anymore, but this should be an easy win.
Benchmarking Results #1
With three changes under our belt lets take a look at the impact. This time I’m running on:
- Polars (commit 5222107)
- tokio (commit 0cf95f0)
- datafusion-common (commit 3e30f77)
- jiff (commit 08abead)
- ring (commit a041a75)
I do one warmup run and for some crates I’ve slightly adapted the tarpaulin command to either get it working, make it not unreasonably slow or include even more code/features. I’ll also be checking the change in coverage to make sure the iteration order change doesn’t cause a different in the results.
For each tarpaulin invocation I share this was ran in hyperfine as:
hyperfine --warmup 1 --export-markdown results.md "$TARPAULIN_COMMAND" After running these I realised I could have ran both tarpaulin commands together if I used absolute paths instead of changing my local tarpaulin installation. I’ll keep that in mind for next time.
Running polars with the command cargo tarpaulin --engine llvm --skip-clean:
| Command | Mean [s] | Min [s] | Max [s] |
|---|---|---|---|
| baseline | 155.460 ± 1.425 | 152.717 | 157.120 |
| iteration order | 135.417 ± 3.720 | 129.325 | 139.286 |
Running datafusion-common with the command
cargo tarpaulin --engine llvm --skip-clean -p datafusion-common:
| Command | Mean [s] | Min [s] | Max [s] |
|---|---|---|---|
| baseline | 10.075 ± 0.069 | 9.942 | 10.155 |
| iteration order | 9.527 ± 0.092 | 9.407 | 9.669 |
Running jiff with cargo tarpaulin --engine llvm --skip-clean --all-features:
| Command | Mean [s] | Min [s] | Max [s] |
|---|---|---|---|
| baseline | 3.241 ± 0.011 | 3.218 | 3.260 |
| iteration order | 3.063 ± 0.064 | 2.892 | 3.119 |
Running ring with cargo tarpaulin --engine llvm --skip-clean --all-features --release:
| Command | Mean [s] | Min [s] | Max [s] |
|---|---|---|---|
| baseline | 77.923 ± 0.954 | 77.394 | 80.529 |
| iteration order | 76.485 ± 0.124 | 76.211 | 76.671 |
Running tokio with cargo tarpaulin --engine llvm --skip-clean --all-features:
| Command | Mean [s] | Min [s] | Max [s] |
|---|---|---|---|
| baseline | 68.236 ± 0.563 | 67.080 | 68.992 |
| iteration order | 59.273 ± 0.477 | 58.751 | 60.484 |
This improvement ranges from 2% to 14% faster than the previous version. Moreover, the coverage never changed so we can be pretty sure this doesn’t introduce any issues!
Going for a Second Win
Time to generate another flamegraph and look for something to attack. This time here’s a screenshot from samply of how it looks, hopefully nothing unfamiliar:
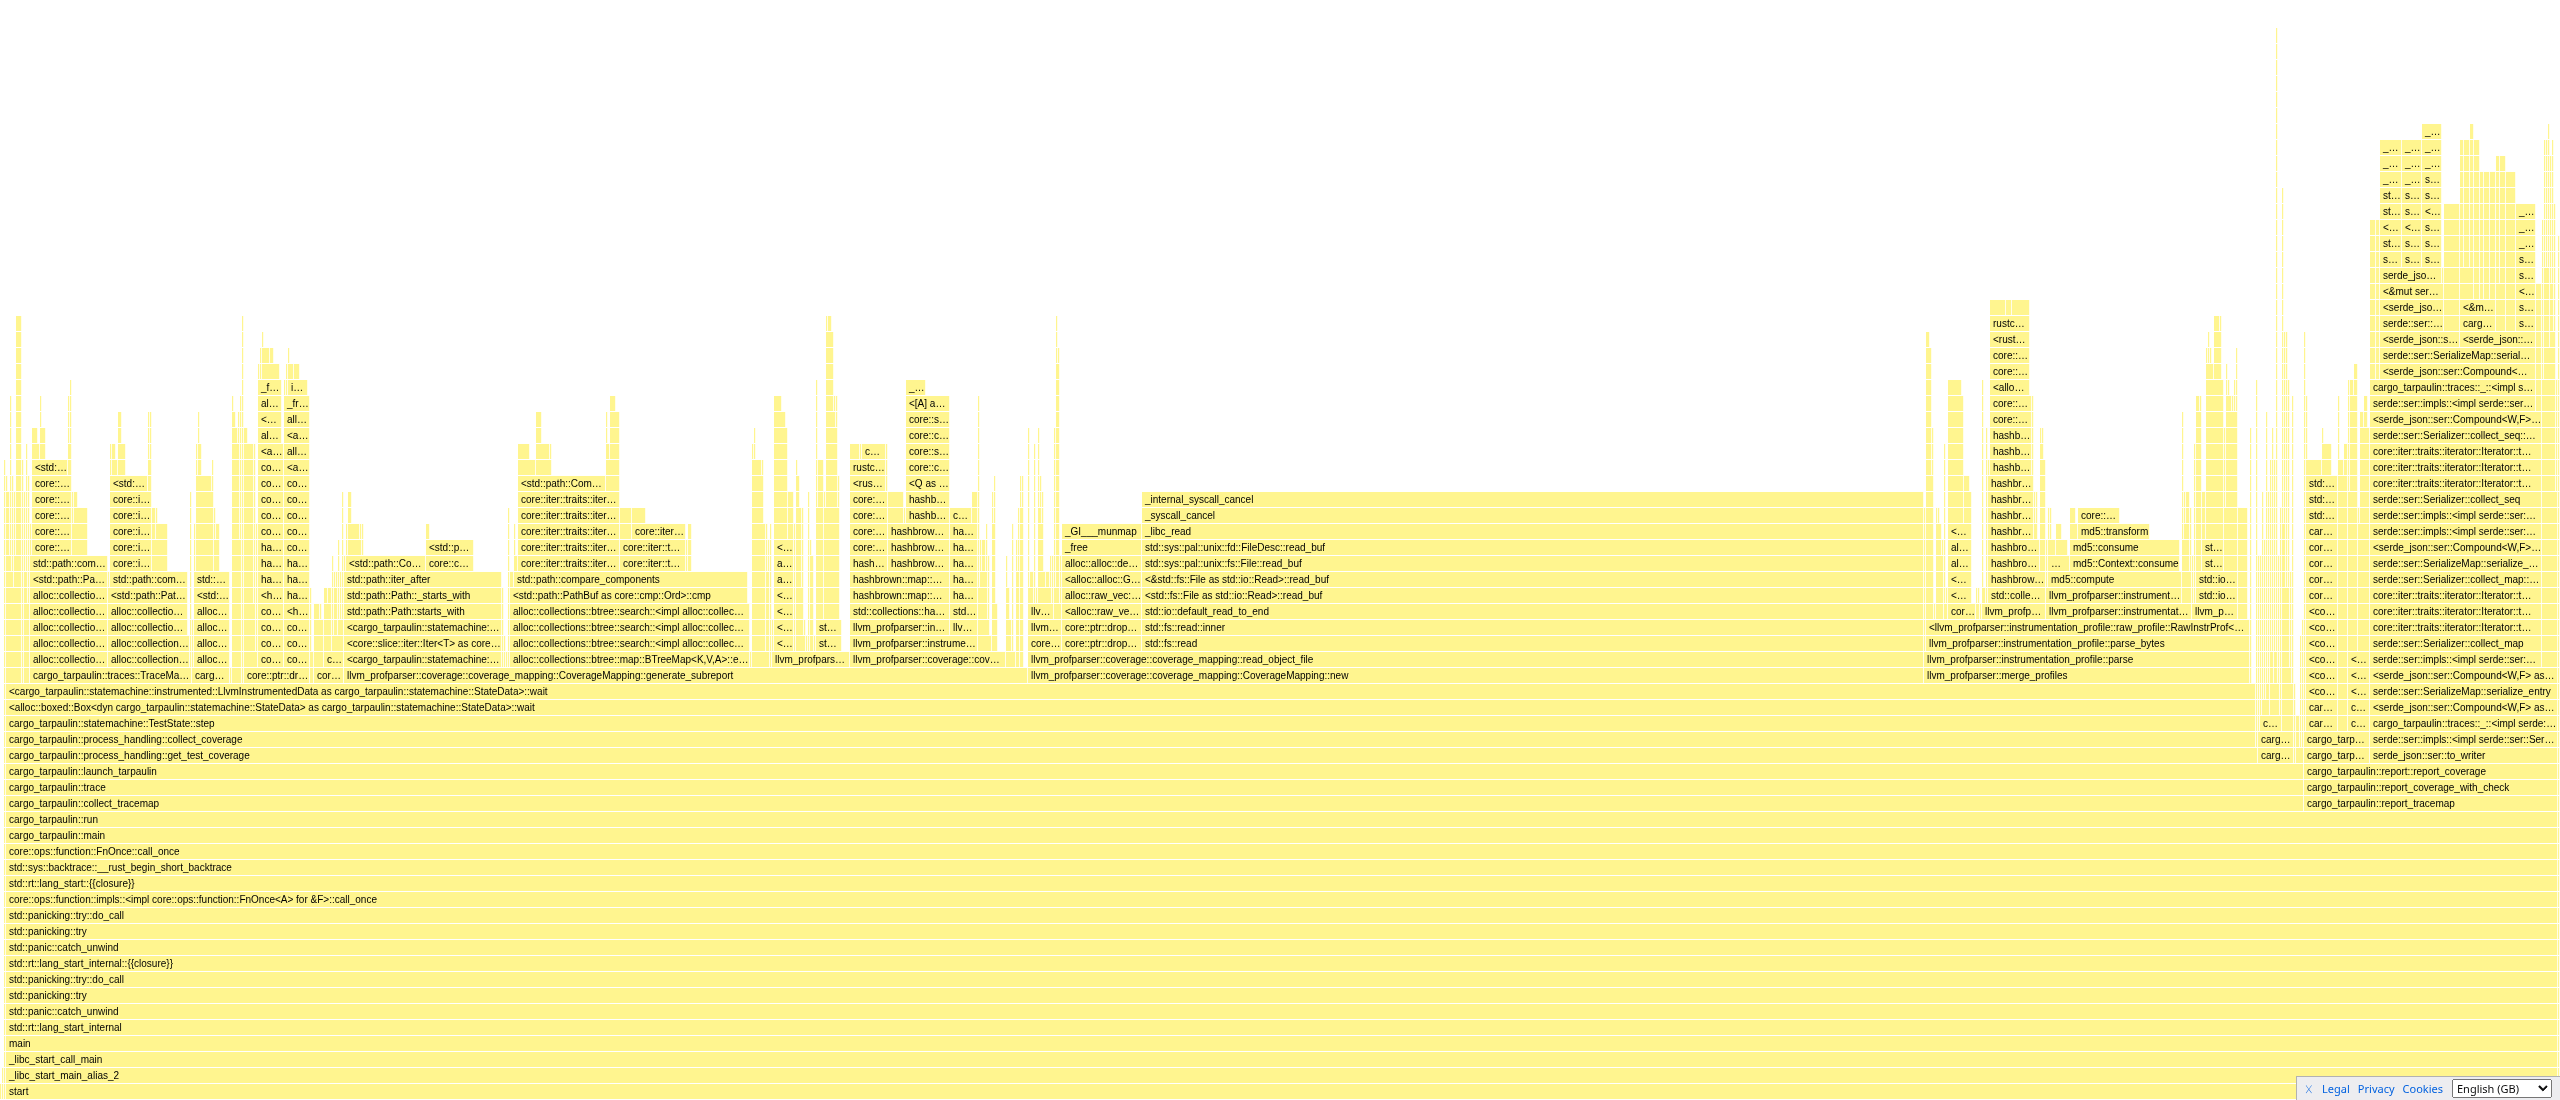
Looking at the flamegraph now for polars I can see reading the object
files is a big one. I do use fs::read to read the object files and
get the sections for parsing of relevant information. But I can probably
avoid reading the entire file and provided those sections are before the
executable code hopefully avoid reading some data.
Before I go too deeply into this lets just patch the code and see what Criterion says. Right changing this:
let binary_data = fs::read(object)?;
let object_file = object::File::parse(&*binary_data)?;
Into:
let binary_data = ReadCache::new(fs::File::open(object)?);
let object_file = object::File::parse(&binary_data)?;
And the parsing functions need a generic parameter added so
that &Section<'_, '_> turns into &Section<'data, '_, R> where
R: ReadRef<'data>.
An initial run with criterion confirms this assumption:
coverage mapping        time:   [23.541 ms 23.817 ms 24.115 ms]
                        change: [-70.666% -69.879% -69.128%] (p = 0.00 < 0.05)
                        Performance has improved.
Found 6 outliers among 100 measurements (6.00%)
  6 (6.00%) high mild
Next step is to look at the order of the object sections and call my parsing code in that order so we roughly read things in order. That should be more cache friendly and hopefully criterion agrees…
Using objdump -h we can list the headers in an ELF file and their
offsets. I don’t see a reason for LLVM to be changing the order
based on architecture and most users are on Linux anyway, so we’ll
stick with the Linux order.
Running it on one of the benchmark binaries with some of the output removed for readability:
$ objdump -h benches/data/mapping/binaries/test_iter-e3db028e51c53c16

benches/data/mapping/binaries/test_iter-e3db028e51c53c16:     file format elf64-x86-64

Sections:
Idx Name          Size      VMA               LMA               File off  Algn
// SNIP
 29 __llvm_prf_cnts 0004ed10  000000000063f9e8  000000000063f9e8  0063f9e8  2**3
                  CONTENTS, ALLOC, LOAD, DATA
 30 __llvm_prf_data 00109900  000000000068e6f8  000000000068e6f8  0068e6f8  2**3
                  CONTENTS, ALLOC, LOAD, DATA
// SNIP
 35 __llvm_covfun 0038cc95  0000000000000000  0000000000000000  0079e198  2**3
                  CONTENTS, READONLY
 36 __llvm_covmap 0000f8d0  0000000000000000  0000000000000000  00b2ae30  2**3
                  CONTENTS, READONLY
// SNIP
This is the output limited to the sections I parse. And, there is a difference
with my order of parsing. I do llvm_covfun, llvm_covmap, llvm_prf_cnts and
then llvm_prf_data. There’s also zero dependencies between the four for parsing
so I can safely reorder them as desired.
coverage mapping        time:   [22.903 ms 23.062 ms 23.236 ms]
                        change: [-4.5429% -3.1690% -1.7429%] (p = 0.00 < 0.05)
                        Performance has improved.
Found 7 outliers among 100 measurements (7.00%)
  4 (4.00%) high mild
  3 (3.00%) high severe
This seems to back up the hypothesis, although it’s a small change relatively and I wouldn’t trust Criterion that much. Micro-benchmarks tend to be rough indicators rather than sure-fire confirmations. Indeed I sometimes see consecutive Criterion runs differ by up to 10% with no changes to the code. Therefore anything below 10% I take with a grain of salt.
However, this change does make logical sense so we’ll keep it. The next step will be running this on our test projects! Hopefully, we’ll see some positive changes.
Benchmarking Results #2
For a level of consistency, I’ll include the previous table with the new results in as the final row. All commands ran are the same as previously stated.
Polars:
| Command | Mean [s] | Min [s] | Max [s] |
|---|---|---|---|
| baseline | 155.460 ± 1.425 | 152.717 | 157.120 |
| iteration order | 135.417 ± 3.720 | 129.325 | 139.286 |
| file optimisation | 93.891 ± 1.646 | 90.838 | 96.526 |
Oh wow another big win, time to see how it does in the other projects!
Datafusion-common:
| Command | Mean [s] | Min [s] | Max [s] |
|---|---|---|---|
| baseline | 10.075 ± 0.069 | 9.942 | 10.155 |
| iteration order | 9.527 ± 0.092 | 9.407 | 9.669 |
| file optimisation | 9.300 ± 0.154 | 8.988 | 9.491 |
Jiff:
| Command | Mean [s] | Min [s] | Max [s] |
|---|---|---|---|
| baseline | 3.241 ± 0.011 | 3.218 | 3.260 |
| iteration order | 3.063 ± 0.064 | 2.892 | 3.119 |
| file optimisation | 3.153 ± 0.021 | 3.112 | 3.178 |
Ring:
| Command | Mean [s] | Min [s] | Max [s] |
|---|---|---|---|
| baseline | 77.923 ± 0.954 | 77.394 | 80.529 |
| iteration order | 76.485 ± 0.124 | 76.211 | 76.671 |
| file optimisation | 77.825 ± 0.943 | 77.140 | 80.136 |
Tokio:
| Command | Mean [s] | Min [s] | Max [s] |
|---|---|---|---|
| baseline | 68.236 ± 0.563 | 67.080 | 68.992 |
| iteration order | 59.273 ± 0.477 | 58.751 | 60.484 |
| file optimisation | 60.592 ± 0.800 | 59.998 | 62.790 |
Well aside from polars and datafusion-common everything has gotten a little bit slower. This could be some noise or a sign this approach isn’t perfect. Although, if it’s only ever a small regression it should be a win overall.
Thinking about it, if I wrap the File in an std::io::BufReader I
might win back some of those losses through larger less frequent file
reads…
Benchmarking Results #3
Time for BufReader to hopefully save the day.
Polars:
| Command | Mean [s] | Min [s] | Max [s] |
|---|---|---|---|
| baseline | 155.460 ± 1.425 | 152.717 | 157.120 |
| iteration order | 135.417 ± 3.720 | 129.325 | 139.286 |
| file optimisation | 93.891 ± 1.646 | 90.838 | 96.526 |
BufReader | 87.733 ± 0.300 | 87.114 | 88.072 |
Datafusion-common:
| Command | Mean [s] | Min [s] | Max [s] |
|---|---|---|---|
| baseline | 10.075 ± 0.069 | 9.942 | 10.155 |
| iteration order | 9.527 ± 0.092 | 9.407 | 9.669 |
| file optimisation | 9.300 ± 0.154 | 8.988 | 9.491 |
BufReader | 9.160 ± 0.065 | 9.055 | 9.231 |
Jiff:
| Command | Mean [s] | Min [s] | Max [s] |
|---|---|---|---|
| baseline | 3.241 ± 0.011 | 3.218 | 3.260 |
| iteration order | 3.063 ± 0.064 | 2.892 | 3.119 |
| file optimisation | 3.153 ± 0.021 | 3.112 | 3.178 |
BufReader | 3.118 ± 0.015 | 3.093 | 3.139 |
Ring:
| Command | Mean [s] | Min [s] | Max [s] |
|---|---|---|---|
| baseline | 77.923 ± 0.954 | 77.394 | 80.529 |
| iteration order | 76.485 ± 0.124 | 76.211 | 76.671 |
| file optimisation | 77.825 ± 0.943 | 77.140 | 80.136 |
BufReader | 77.324 ± 0.108 | 77.213 | 77.505 |
Tokio:
| Command | Mean [s] | Min [s] | Max [s] |
|---|---|---|---|
| baseline | 68.236 ± 0.563 | 67.080 | 68.992 |
| iteration order | 59.273 ± 0.477 | 58.751 | 60.484 |
| file optimisation | 60.592 ± 0.800 | 59.998 | 62.790 |
BufReader | 57.703 ± 0.396 | 56.901 | 58.145 |
Okay this looks better again. I could play around with memmap, but it’s not a safe OS level API and I don’t think this is worth adding unsafe into things for.
Let’s also take a look at the flamegraph just to see how things have been shaken up
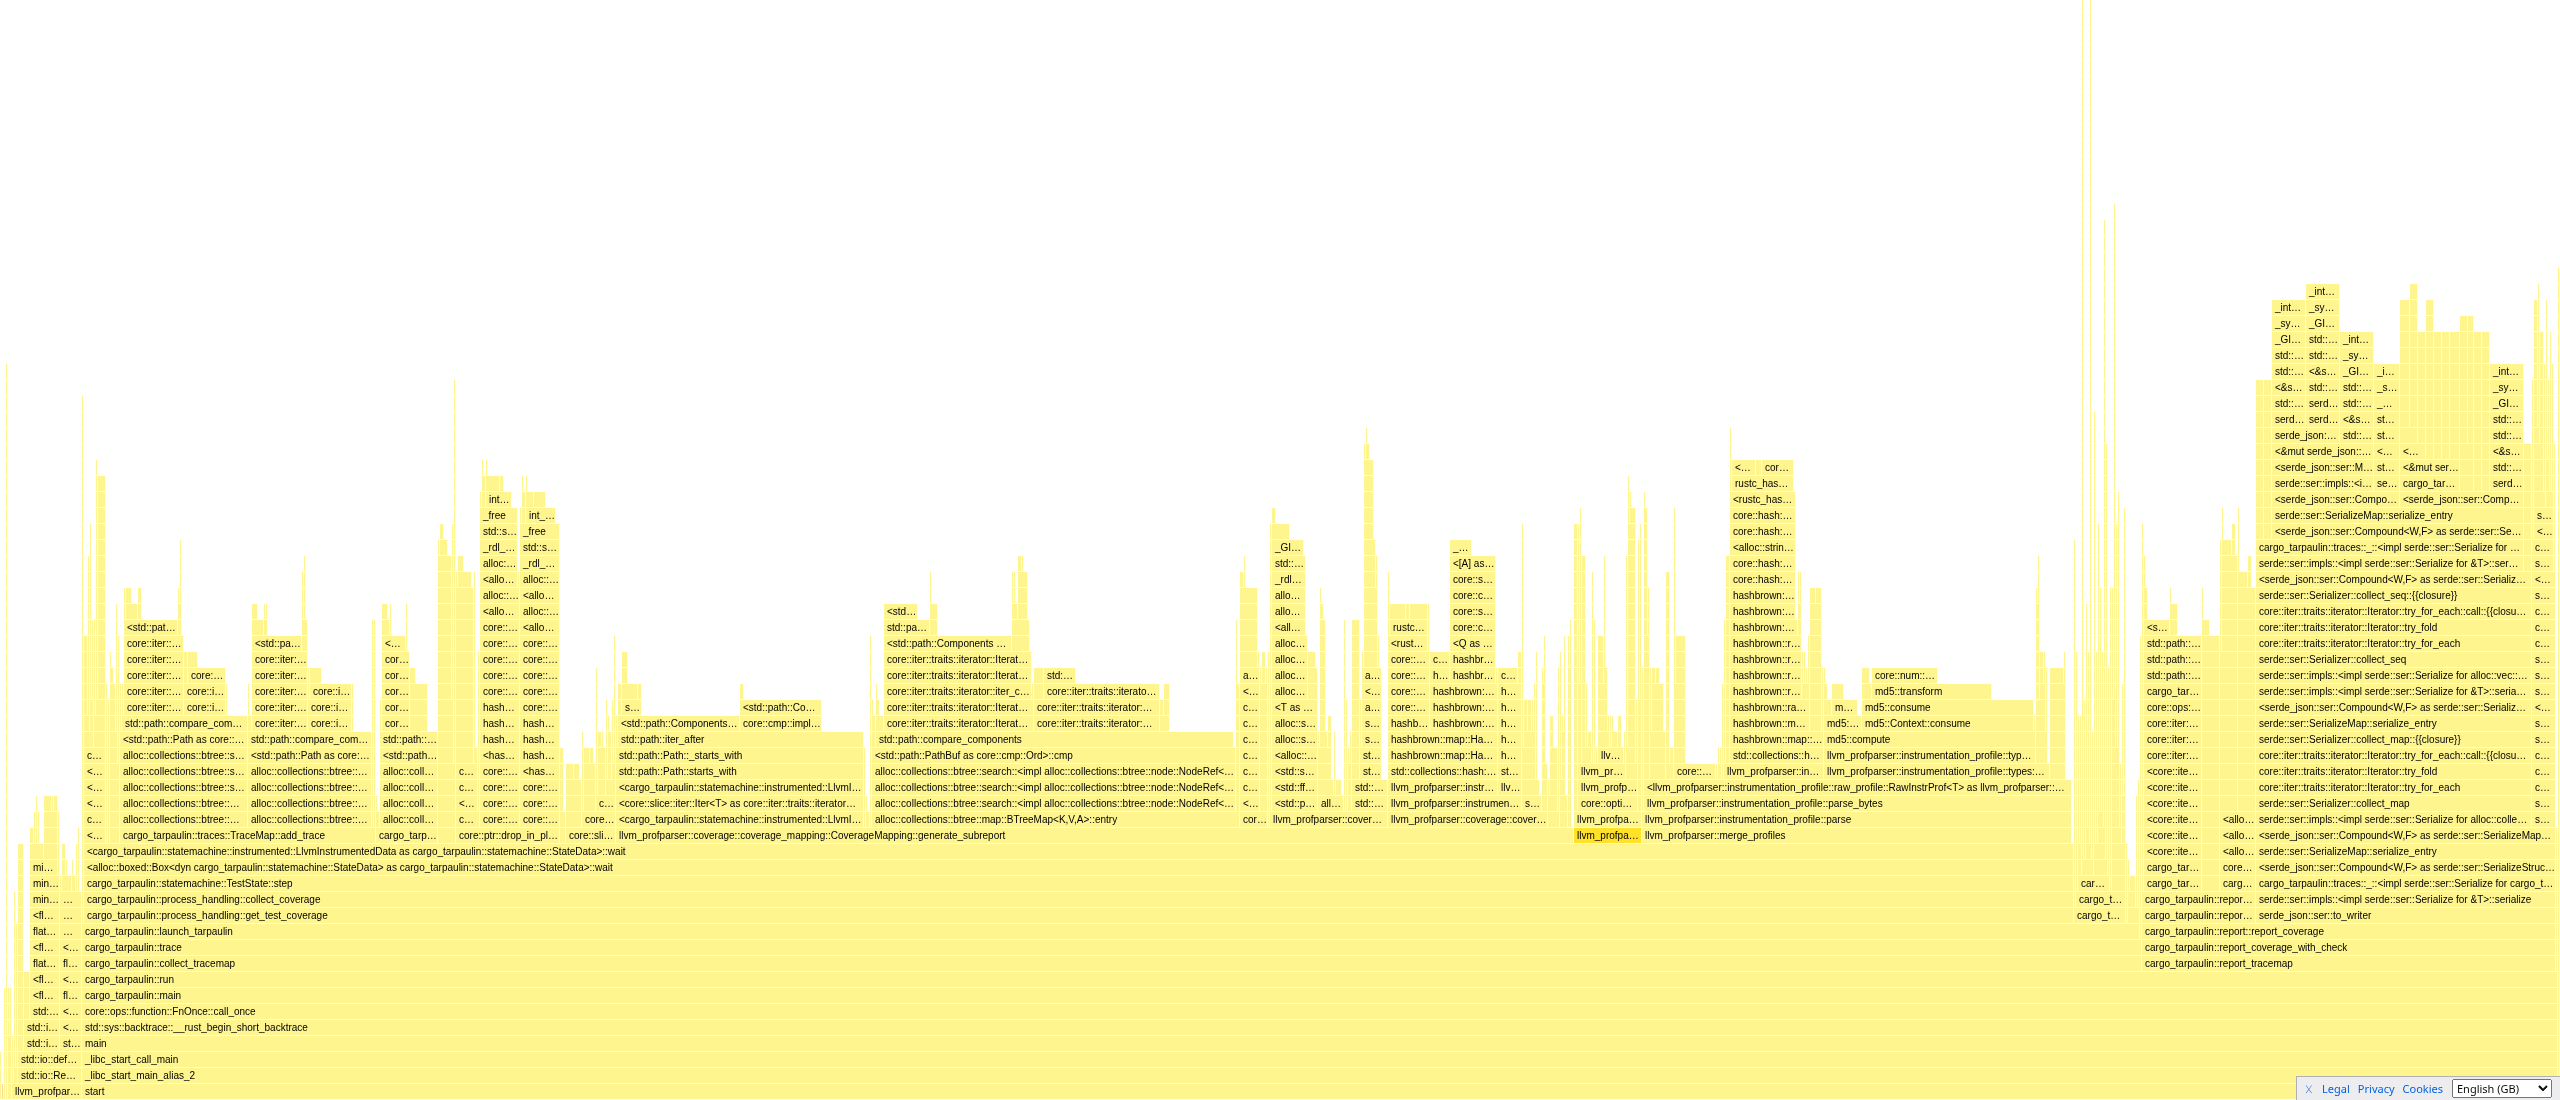
Here I actually highlighted the CoverageMapping::new call because whereas before
it took up most of the time, now it’s so small you can’t read the symbol name
without expanding on the block. I imagine for projects that generate a lot of
very large test binaries this change likely impacts the most. This also includes
high LoC counts in the crate plus used dependency code as that will increase the
symbol table and count metadata in the ELF sections (and other object files of
your own choosing).
Final Change Today
Okay, we’ve done a lot of changes with not a lot of diffs to the project and gotten some big changes in performance. Now there’s one more thing I’d like to try out from this issue.
[profile.release]
codegen-units = 1
lto = true
Link-Time Optimisation (LTO) is a technique that applies optimisations at the link stage taking into account all the crates being linked in and not just optimising crates individually. It should decrease the binary size and hopefully up the performance as the issue states. Let’s try it out:
LTO Results
Polars:
| Command | Mean [s] | Min [s] | Max [s] |
|---|---|---|---|
| baseline | 155.460 ± 1.425 | 152.717 | 157.120 |
| iteration order | 135.417 ± 3.720 | 129.325 | 139.286 |
| file optimisation | 93.891 ± 1.646 | 90.838 | 96.526 |
BufReader | 87.733 ± 0.300 | 87.114 | 88.072 |
| LTO | 85.787 ± 1.350 | 82.055 | 87.070 |
Datafusion-common:
| Command | Mean [s] | Min [s] | Max [s] |
|---|---|---|---|
| baseline | 10.075 ± 0.069 | 9.942 | 10.155 |
| iteration order | 9.527 ± 0.092 | 9.407 | 9.669 |
| file optimisation | 9.300 ± 0.154 | 8.988 | 9.491 |
BufReader | 9.160 ± 0.065 | 9.055 | 9.231 |
| LTO | 8.944 ± 0.058 | 8.848 | 9.020 |
Jiff:
| Command | Mean [s] | Min [s] | Max [s] |
|---|---|---|---|
| baseline | 3.241 ± 0.011 | 3.218 | 3.260 |
| iteration order | 3.063 ± 0.064 | 2.892 | 3.119 |
| file optimisation | 3.153 ± 0.021 | 3.112 | 3.178 |
BufReader | 3.118 ± 0.015 | 3.093 | 3.139 |
| LTO | 3.065 ± 0.027 | 3.033 | 3.109 |
Ring:
| Command | Mean [s] | Min [s] | Max [s] |
|---|---|---|---|
| baseline | 77.923 ± 0.954 | 77.394 | 80.529 |
| iteration order | 76.485 ± 0.124 | 76.211 | 76.671 |
| file optimisation | 77.825 ± 0.943 | 77.140 | 80.136 |
BufReader | 77.324 ± 0.108 | 77.213 | 77.505 |
| LTO | 77.296 ± 0.129 | 77.143 | 77.518 |
Tokio:
| Command | Mean [s] | Min [s] | Max [s] |
|---|---|---|---|
| baseline | 68.236 ± 0.563 | 67.080 | 68.992 |
| iteration order | 59.273 ± 0.477 | 58.751 | 60.484 |
| file optimisation | 60.592 ± 0.800 | 59.998 | 62.790 |
BufReader | 57.703 ± 0.396 | 56.901 | 58.145 |
| LTO | 56.987 ± 0.438 | 56.427 | 57.963 |
Conclusion
Well time for the takeaways. I guess generally, people should use samply over perf if it works out of the box. That is if you’re not using any perf features that aren’t supported (if there are any). Doing multiple runs and statistics are nice. Buffering file IO and reading the least amount of data possible does have knock on effects. Preallocate storage when possible and sometimes iteration order matters a lot. Benchmark on a variety of real life workloads as well.
There’s not some big magic takeaway here. Performance work is often just trying to get better measurements to judge your changes. Then when you have them trying to reduce allocations, instructions executed and data read/written.
Being methodical helps, noting down your results and keeping raw data around for analysis is also very helpful.
Now all this is done I should set about the process of releasing it all to the general public. Laters!