In the previous sections we’ve designed and implemented a websocket service that takes a stream of audio, resamples it and runs a hypothetical machine learning model on it either working on voiced segments or the entire stream. This is all well and good but we need to have insights into the performance of the service. This is where the metrics come in. All code can be found here and in future may be split out into a separate branch for this chapter.
Traditionally, people have aimed to hit some “3 pillars of observability”. The three pillars are logs, metrics and distributed traces. There’s some criticism of these ideals as they can be hard to work with, limited in what they let you see and not great at helping you fix customer experience. Large amounts of conceptually separate and unlinked data is harder to work with that a snapshot of the state of the system at the moment things go wrong.
But with that in mind, metrics can still have some usage. In benchmarking, and
some critical alerts. So here we’ll mainly be focusing on setting up a
/metrics API which can be called to grab prometheus metrics.
One thing to keep in mind, unlike a normal REST API where we can measure things like response time easily here things aren’t so easy. For the more common use case of the VAD (Voice Activity Detection) segmented audio the first response will be some point after the first voiced frame appears. Additionally, if the user hasn’t requested interim results the response for a complete utterance will be some latency after the last voiced frame appears. Because of this things like response time become harder to measure and the normal metrics people use to monitor performance start to become less strongly correlated to performance or harder to generate.
The Metrics Ecosystem
For the metrics implementation we’ll be using metrics-rs/metrics and it’s related ecosystem. This provides a number of handy macros for registering and updating metrics and avoid us having to pass handles around too much.
Usage isn’t too hard, we can use macros like so to describe a metric and add some documentation to the metric:
describe_counter!("request_count", Unit::Count, "number of requests");And then incrementing the counter we do:
counter!("request_count").increment(1);Personally, I’m not too much of a fan of stringly typed things, so for metric areas you’ll either see me using the strings in one small concentrated area or if it’s for code that’s meant to be called outside of the metrics module creating an enum like:
#[derive(Copy, Clone, Eq)]
pub enum Subsystem {
    AudioDecoding,
    Model,
}

impl Subsystem {
    fn name(&self) -> &'static str {
        match self {
            Self::AudioDecoding => "audio_decoding",
            Self::Model => "model",
        }
    }
}
To save rewriting a few very similar enum impls, I’ll put a
comment above the enum like // marker enum.
I also don’t want to be pushing metrics out but rather have something call a
/metrics endpoint. This avoids some of the annoying log messages about no
such endpoint when a metrics collector isn’t around and makes configuration
easier. To add this to our Axum server we’ll create a type called
AppMetricsEncoder like so:
use metrics_exporter_prometheus::{PrometheusBuilder, PrometheusHandle};

pub struct AppMetricsEncoder {
    pub prometheus_handle: PrometheusHandle,
}

impl AppMetricsEncoder {
    pub fn new() -> Self {
        let builder = PrometheusBuilder::new();

        let prometheus_handle = builder.install_recorder().unwrap();
        Self {
            prometheus_handle,
        }
    }

    pub fn render(&self) -> String {
        self.prometheus_handle.render()
    }

    pub fn update(&self) {
        self.prometheus_handle.run_upkeep();
    }
}
Adding the /metrics endpoint then looks like:
async fn get_metrics(Extension(metrics_ext): Extension<Arc<AppMetricsEncoder>>) -> Response {
    Response::new(metrics_ext.render().into())
}

pub fn make_service_router(app_state: Arc<StreamingContext>) -> Router {
    let metrics_encoder = Arc::new(AppMetricsEncoder::new());
    let collector_metrics = metrics_encoder.clone();
    // Keep the metrics upkeep going in a background task
    let _ = tokio::task::spawn(
        async move {
            loop {
                collector_metrics.update();
                tokio::time::sleep(Duration::from_secs(5)).await;
            }
        }
    );
    Router::new()
        .route(
            "/api/v1/simple",
            get({
                move |ws, app_state| {
                    ws_handler(ws, false, app_state)
                }
            }),
        )
        .route(
            "/api/v1/segmented",
            get({
                move |ws, app_state| {
                    ws_handler(ws, true, app_state)
                }
            }),
        )
        .route("/api/v1/health", get(health_check))
        .route("/metrics", get(get_metrics))
        .layer(Extension(metrics_encoder))
        .layer(Extension(app_state))
}
If we call /metrics now we’ll get an empty prometheus response, which is
progress but we’ve still got work to do. Now, without further ado lets pick an
area we want metrics for and go about implementing them!
Tokio Metrics
The tokio team have been working on
tokio_metrics
to collect metrics for a task. As we expect our work will have parts which
are more CPU bound such as inference there’s always the chance we might
unwittingly block the executor and reduce throughput.
There’s also a great part of the docs called Why are my tasks slow which explains all the metrics and how they can be interpreted.
There’s a lot of unstable metrics here, we’re going to stay to the stable set however. For counters we’ll be capturing:
instrumented_count- how many tasks have been instrumenteddropped_count- how many tasks have been droppedfirst_poll_count- how many tasks have been polled at least oncetotal_idled_count- total number of idled taskstotal_poll_count- total number of times a task was polledtotal_fast_poll_count- number of polls that were fasttotal_slow_poll_count- number of polls that were slowtotal_short_delay_count- number of tasks with short scheduling delaystotal_long_delay_count- number of tasks with long scheduling delays
In this list, total_poll_count should be equivalent to total_fast_poll_count + total_slow_poll_count
making it a little redundant. But one extra metric doesn’t hurt and it functions
as a sanity check that the metrics are correct.
We’ll also collect some histogram metrics, these will be:
total_first_poll_delay- total time waited until polling a task for the first timetotal_idle_duration- total time a task is spent idletotal_scheduled_duration- total time waiting to be polled after wakingtotal_poll_duration- total time spent polling the futuretotal_fast_poll_duration- total time spent in fast pollstotal_slow_poll_duration- total time spent in slow pollstotal_short_delay_duration- total duration of short scheduling delaystotal_long_delay_duration- total duration of long scheduling delays
And finally a gauges used to track max/min values over time:
max_idle_durationthe maximum time the task has spent idle.
There’s also runtime metrics that are global outside the tasks. For these we’ll collect:
total_park_count- a counter for the total number of times worker threads parkedtotal_busy_duration- a counter for the total time spent busyelapsed- a histogram of the amount of time between observing the metrics
The rest of the metrics are gauges, some of these won’t change but it can be good to see them to validate your assumptions of the deployed system:
workers_count- number of tokio workerslive_tasks_count- number of tasks that currently existglobal_queue_depth- number of tasks in the global queue. This will be tasks that are spawned or notified from a non-worker threadmin_park_count- minimum amount of times a worker thread parkedmax_park_count- maximum amount of times a worker thread parkedmin_busy_duration- minimum amount of time a worker thread was busymax_busy_duration- the maximum amount of time a worker thread was busy
One thing is for sure, none of these metrics on their own necessarily mean
latency is impacted as they often work together. For example, an increased
total_long_delay_count could result from fewer task polls. But understanding
what the runtime is doing is often a useful step in diagnosing performance
issues. There’s also a lot of metrics that let us see when the runtime is busy
and give us options to try and spot when the service is experiencing high loads.
We need to make a TaskMonitor for each task and keep it around for the
duration of the program. To keep the monitors around we’ll make a struct and
dump them all in there. Additionally, the monitors will have to be polled
in a background thread and the values extracted and put into our metrics.
Our initial struct looks like:
pub struct StreamingMonitors {
    runtime: RuntimeMonitor,
    pub route: TaskMonitor,
    pub client_receiver: TaskMonitor,
    pub audio_decoding: TaskMonitor,
    pub inference: TaskMonitor,
}

impl StreamingMonitors {
    pub fn new() -> Self {
        let runtime = RuntimeMonitor::new(&tokio::runtime::Handle::current());
        Self {
            runtime,
            route: TaskMonitor::new(),
            client_receiver: TaskMonitor::new(),
            audio_decoding: TaskMonitor::new(),
            inference: TaskMonitor::new(),
        }
    }

    pub fn run_collector(&self) {
        let mut route_interval = self.route.intervals();
        let mut audio_interval = self.audio_decoding.intervals();
        let mut client_interval = self.client_receiver.intervals();
        let mut inference_interval = self.inference.intervals();

        if let Some(metric) = route_interval.next() {
            update_metrics(Subsystem::Routing, metric);
        }
        if let Some(metric) = audio_interval.next() {
            update_metrics(Subsystem::AudioDecoding, metric);
        }
        if let Some(metric) = client_interval.next() {
            update_metrics(Subsystem::Client, metric);
        }
        if let Some(metric) = inference_interval.next() {
            update_metrics(Subsystem::Inference, metric);
        }
    }
}

fn update_metrics(system: Subsystem, metrics: TaskMetrics) {
    let system = system.name();

    counter!("instrumented_count", "task" => system).increment(metrics.instrumented_count);
    counter!("dropped_count", "task" => system).increment(metrics.dropped_count);
    counter!("first_poll_count", "task" => system).increment(metrics.first_poll_count);
    counter!("total_idled_count", "task" => system).increment(metrics.total_idled_count);
    counter!("total_poll_count", "task" => system).increment(metrics.total_poll_count);
    counter!("total_fast_poll_count", "task" => system).increment(metrics.total_fast_poll_count);
    counter!("total_slow_poll_count", "task" => system).increment(metrics.total_slow_poll_count);
    counter!("total_short_delay_count", "task" => system)
        .increment(metrics.total_short_delay_count);
    counter!("total_long_delay_count", "task" => system).increment(metrics.total_long_delay_count);

    histogram!("total_first_poll_delay", "task" => system)
        .record(metrics.total_first_poll_delay.as_secs_f64());
    histogram!("total_idle_duration", "task" => system)
        .record(metrics.total_idle_duration.as_secs_f64());
    histogram!("total_scheduled_duration", "task" => system)
        .record(metrics.total_scheduled_duration.as_secs_f64());
    histogram!("total_poll_duration", "task" => system)
        .record(metrics.total_poll_duration.as_secs_f64());
    histogram!("total_fast_poll_duration", "task" => system)
        .record(metrics.total_fast_poll_duration.as_secs_f64());
    histogram!("total_slow_poll_duration", "task" => system)
        .record(metrics.total_slow_poll_duration.as_secs_f64());
    histogram!("total_short_delay_duration", "task" => system)
        .record(metrics.total_short_delay_duration.as_secs_f64());
    histogram!("total_long_delay_duration", "task" => system)
        .record(metrics.total_long_delay_duration.as_secs_f64());

    gauge!("max_idle_duration", "task" => system).set(metrics.max_idle_duration.as_secs_f64());
}

fn update_runtime_metrics(metrics: RuntimeMetrics) {
    gauge!("workers_count").set(metrics.workers_count as f64);
    gauge!("live_tasks_count").set(metrics.live_tasks_count as f64);
    gauge!("global_queue_depth").set(metrics.global_queue_depth as f64);
    gauge!("max_park_count").set(metrics.max_park_count as f64);
    gauge!("min_park_count").set(metrics.min_park_count as f64);
    gauge!("max_busy_duration").set(metrics.max_busy_duration.as_secs_f64());
    gauge!("min_busy_duration").set(metrics.min_busy_duration.as_secs_f64());

    counter!("total_park_count").increment(metrics.total_park_count);
    counter!("total_busy_duration").increment(metrics.total_busy_duration.as_nanos() as u64);

    histogram!("elapsed").record(metrics.elapsed.as_secs_f64());
}
We’ll add the monitors to our metrics encoder type:
pub struct AppMetricsEncoder {
    pub prometheus_handle: PrometheusHandle,
    pub metrics: StreamingMonitors,
}
Integrating this into our function to setup the Axum router we end up with this code:
pub fn make_service_router(app_state: Arc<StreamingContext>) -> Router {
    let streaming_monitor = StreamingMonitors::new();
    let metrics_encoder = Arc::new(AppMetricsEncoder::new(streaming_monitor));
    let collector_metrics = metrics_encoder.clone();
    let _ = tokio::task::spawn(
        async move {
            loop {
                collector_metrics.update();
                tokio::time::sleep(Duration::from_secs(5)).await;
            }
        }
    );
    Router::new()
        .route(
            "/api/v1/simple",
            get({
                move |ws, app_state, metrics_enc: Extension<Arc<AppMetricsEncoder>>| {
                    let route = metrics_enc.metrics.route.clone();
                    TaskMonitor::instrument(&route, ws_handler(ws, false, app_state, metrics_enc))
                }
            }),
        )
        .route(
            "/api/v1/segmented",
            get({
                move |ws, app_state, metrics_enc: Extension<Arc<AppMetricsEncoder>>| {
                    let route = metrics_enc.metrics.route.clone();
                    TaskMonitor::instrument(&route, ws_handler(ws, true, app_state, metrics_enc))
                }
            }),
        )
        .route("/api/v1/health", get(health_check))
        .route("/metrics", get(get_metrics))
        .layer(Extension(metrics_encoder))
        .layer(Extension(app_state))
}
We now also pass the metrics encoder into the ws_handler function so we can
instrument the various tasks we care about.
Instrumenting our tasks always looks similar, for example here is the instrumentation of the the task sending messages back to the client:
let recv_task = TaskMonitor::instrument(
    &metrics_encoder.metrics.client_receiver,
    client_receiver
        .map(create_websocket_message)
        .forward(sender)
        .map(|result| {
            if let Err(e) = result {
                error!("error sending websocket msg: {}", e);
            }
        })
);
The task for the audio decoding and resampling:
let transcoding_task = tokio::task::spawn(
    TaskMonitor::instrument(
        &metrics_encoder.metrics.audio_decoding,
        decode_audio(start.format, audio_bytes_rx, senders),
    )
);
And the inference task is:
let inference_task = TaskMonitor::instrument(
    &metrics_encoder.metrics.inference,
    async move {
        if vad_processing {
            context
                .segmented_runner(
                    start_cloned,
                    channel_id,
                    samples_rx,
                    client_sender_clone,
                )
                .await
        } else {
            context
                .inference_runner(channel_id, samples_rx, client_sender_clone)
                .await
        }
    }
);
With these changes made in our websocket handling function, we’re now getting task metrics from the main tasks we spawn for a request.
But wait, why are we doing TaskMonitor::instrument(&monitor, future) when
TaskMonitor takes &self. The reason is in the code I’m also using the
tracing::Instrument trait and as a result I get this error:
error[E0308]: mismatched types
  --> src/axum_server.rs:89:9
   |
88 |           monitors.client_receiver.instrument(
   |                                    ---------- arguments to this method are incorrect
89 | /         client_receiver
90 | |             .map(create_websocket_message)
91 | |             .forward(sender)
92 | |             .map(|result| {
...  |
95 | |                 }
96 | |             })
   | |______________^ expected `Span`, found `Map<Forward<Map<ReceiverStream<ApiResponse>, ...>, ...>, ...>`
   |
   = note: expected struct `tracing::Span`
              found struct `futures::future::Map<Forward<futures::stream::Map<ReceiverStream<api_types::ApiResponse>, fn(api_types::ApiResponse) -> Result<axum::extract::ws::Message, axum::Error> {create_websocket_message}>, SplitSink<WebSocket, axum::extract::ws::Message>>, {closure@src/axum_server.rs:92:18: 92:26}>`
note: method defined here
  --> /home/xd009642/.cargo/registry/src/index.crates.io-6f17d22bba15001f/tracing-0.1.40/src/instrument.rs:86:8
   |
86 |     fn instrument(self, span: Span) -> Instrumented<Self> {
   |        ^^^^^^^^^^
There will be a way around this, but the easiest way felt to be explicitly
passing in the &self parameter. As with tokio channels and audio channels in
a previous entry, naming overlap has proven to be a source of minor pain.
Panics
Our current code uses a lot of tokio::task::spawn and
tokio::task::spawn_blocking to keep data streaming through the pipeline
stages and avoiding blocking the runtime. However, any time someone uses
one of these functions we want them to be checking the outer error to make
sure the spawned fucntion or future hasn’t panicked. A panic would indicate
something’s gone wrong and either means our API should change it’s health
status or some engineer should be alerted that there’s an issue in the code.
Reviewing every usage of these functions to spot out missed panics is a bit
onerous and occasionally something might slip through the cracks. So let’s
create our own version of them and pass in a metrics::Counter which will
count the times we’ve panicked in this task.
use metrics::Counter;
use std::future::Future;
use tokio::task;
use tracing::{Instrument, Span};

pub fn spawn<F>(future: F, panic_inc: Counter) -> impl Future<Output = anyhow::Result<F::Output>>
where
    F: Future + Send + 'static,
    F::Output: Send + 'static,
{
    let current = Span::current();
    let future = task::spawn(future).instrument(current);
    async move {
        let res = future.await;
        match res {
            Ok(v) => Ok(v),
            Err(e) => {
                panic_inc.increment(1);
                Err(anyhow::anyhow!(e))
            }
        }
    }
}

pub fn spawn_blocking<F, R>(f: F, panic_inc: Counter) -> impl Future<Output = anyhow::Result<R>>
where
    F: FnOnce() -> R + Send + 'static,
    R: Send + 'static,
{
    let current = Span::current();
    let future = task::spawn_blocking(f).instrument(current);
    async move {
        let res = future.await;
        match res {
            Ok(v) => Ok(v),
            Err(e) => {
                panic_inc.increment(1);
                Err(anyhow::anyhow!(e))
            }
        }
    }
}
Tokio spawns will keep on running on a separate worker without being manually
awaited and don’t cancel on drop. We want to maintain the same behaviour to
avoid confusion so we run the spawn commands and then move them into an async
block to be awaited and the counter incremented.
This does mean if a task panics but we never await the task and drop it the
metric won’t increment. But there will be a compiler warning about an unused
Future so these parts of the code will stand out.
Notice this also instruments our spawns in the current span which we want so our tracing context all lines up.
This was relatively easy. But how can we make sure other people working on the code use our spawns instead of the tokio one? Well, Clippy actually has some nice functionality for this.
In the project I’ll create a clippy.toml with the following contents:
disallowed-methods = [
    "tokio::task::spawn_blocking",
    "tokio::task::spawn"
]
And then at the top of src/task.rs where I’ve added this code I add the
following clippy attribute:
#![allow(clippy::disallowed_methods, clippy::manual_async_fn)]This means clippy will let us use the tokio spawns in this module and no
where else. It will also silent the warning lint about us returning an
impl Future type instead of writing an async function.
Audio Processing Metrics
When looking at the performance of audio processing code, the raw time is often unhelpful. It’s fairly intuitive that 5 seconds of audio should be processed a lot faster than 1 hour of audio. Because of this the latency of audio streaming systems is often measured in terms of the Real-Time Factor (RTF). The RTF is defined as follows:
$$\text{real time factor}=\frac{\text{processing time}}{\text{audio duration}}$$
This means that anything above 1 is slower than real-time, and anything below 1 runs faster than real-time. So when making a streaming service you want to always aim to be comfortably below 1.
Additionally, despite the durations being less useful we do want to store these as well. RTF often doesn’t scale linearly - a model might have a fastest possible time it can run. Anything below a duration will take that time, anything above will increase as the input length increases. If in production we start to see RTF distributions dramatically different to what we measured before deploying it’s useful to see how the audio durations our customers provide compares to our benchmarking data.
RTF only impacts parts of the pipeline where the audio length plays a part in the model. So initially we’ll just be measuring the decoding, VAD and the inference model. We also know before we start these tasks how much audio we’re supplying so we can be a bit hip and use an RAII scope guard to record the metrics.
The implementation of this RTF scope guard and the metric enum looks like so:
pub enum RtfMetric {
    AudioDecoding,
    Vad,
    Model,
}

// const fn name(&self) -> &'static str omitted for brevity

pub struct RtfMetricGuard {
    clock: Clock,
    now: Instant,
    audio_duration: Duration,
    rtf: Histogram,
    processing_duration: Histogram,
}

impl RtfMetricGuard {
    pub fn new(audio_duration: Duration, metric: RtfMetric) -> Self {
        let clock = Clock::new();
        let name = metric.name();
        histogram!("media_duration_seconds", "pipeline" => name)
            .record(audio_duration.as_secs_f64());
        let processing_duration =
            histogram!("processing_duration_seconds", "pipeline_stage" => name);
        let rtf = histogram!("rtf", "pipeline" => name);
        let now = clock.now();
        Self {
            clock,
            rtf,
            audio_duration,
            processing_duration,
            now,
        }
    }
}

impl Drop for RtfMetricGuard {
    fn drop(&mut self) {
        let end = self.clock.now();
        let processing_duration = end.duration_since(self.now);
        self.processing_duration
            .record(processing_duration.as_secs_f64());
        let rtf = processing_duration.as_secs_f64() / self.audio_duration.as_secs_f64();
        self.rtf.record(rtf);
    }
}
The histogram type here is a metrics::Histogram. We do have to do some work
to setup the buckets that we’ll use when reporting these metrics which I’ll
do when the metrics encoder is created. The buckets will be another const fn
on the metric type:
impl AppMetricsEncoder {
    pub fn new() -> Self {
        let builder = PrometheusBuilder::new();

        let builder = describe_audio_metrics(builder);

        let prometheus_handle = builder.install_recorder().unwrap();
        let metrics = StreamingMonitors::new();
        Self {
            metrics,
            prometheus_handle,
        }
    }
}

impl RtfMetric {
    const fn rtf_buckets() -> &'static [f64] {
        &[
            0.01, 0.05, 0.1, 0.2, 0.3, 0.4, 0.5, 0.75, 1.0, 1.1, 1.2, 1.3, 1.4, 1.5, 1.75, 2.0, 4.0, 6.0,
            8.0, 10.0, 15.0,
        ]
    }
}

fn describe_audio_metrics(builder: PrometheusBuilder) -> PrometheusBuilder {
    describe_histogram!(
        "media_duration_seconds",
        Unit::Seconds,
        "Duration of audio."
    );
    describe_histogram!(
        "processing_duration_seconds",
        Unit::Seconds,
        "Duration of processing time."
    );
    describe_histogram!("rtf", "Real-Time Factor of the processing");

    builder
        .set_buckets_for_metric(Matcher::Suffix("rtf".to_string()), RtfMetric::rtf_buckets())
        .unwrap()
}
In this sample I’ve decided to set buckets for the RTF and not for the duration. In Prometheus this means the durations will end up as summaries where we get stats like the p50, P90, P99, whereas the RTFs we will get how many entries are in each bucket. We’re able to do this for the RTF because we have a more well defined range of what is acceptable for real-time processing. For durations we don’t have a range on when incoming audio should be split into smaller chunks, hence the decision to use summaries.
We can see this guard used to track the VAD RTF as follows:
let duration =
    Duration::from_secs_f32(audio.len() as f32 / MODEL_SAMPLE_RATE as f32);
let guard = RtfMetricGuard::new(duration, RtfMetric::Vad);
let events = vad.process(&audio)?;
std::mem::drop(guard);
And in the model inference code:
impl Model {
    #[instrument(skip_all)]
    pub fn infer(&self, data: &[f32]) -> anyhow::Result<Output> {
        // Set up some basic metrics tracking
        let duration = Duration::from_secs_f32(data.len() as f32 / MODEL_SAMPLE_RATE as f32);
        let _guard = RtfMetricGuard::new(duration, RtfMetric::Model);

        // Rest of inference code
    }
}
Improving on this
Right we’ve got an initial design now, and it’s been done in an more exploratory
fashion as I get to grips with tokio-metrics and recording what we want to
record. While writing this in fact I’ve been grappling some of these same
problems in my day job in different types of streaming services and subsequently
revised some parts of the initial implementation built up above.
Adding, metrics into our code has worked, but now there’s a bunch more boilerplate we find ourselves adding wherever we want to add metrics. In an ideal world we wouldn’t have to think about the metrics system, it would just come by default as we write the code we find intuitive. With anything you add to a system you want to minimise developer friction for other contributors.
With that in mind how do we make this better?
Reducing Boilerplate
There’s a lot of boilerplate in the metrics module and some parts of it could
hide hard to spot copy-and-paste errors. Let’s use a small helper function to
simplify getting the metrics from the TaskMonitor
With this function below:
fn update_intervals(subsystem: Subsystem, monitor: &TaskMonitor) {
    let mut interval = monitor.intervals();
    if let Some(metric) = interval.next() {
        update_metrics(subsystem, metric);
    }
}
We can turn the following code:
pub fn run_collector(&self) {
    let mut route_interval = self.route.intervals();
    let mut audio_interval = self.audio_decoding.intervals();
    let mut client_interval = self.client_receiver.intervals();
    let mut inference_interval = self.inference.intervals();

    if let Some(metric) = route_interval.next() {
        update_metrics(Subsystem::Routing, metric);
    }
    if let Some(metric) = audio_interval.next() {
        update_metrics(Subsystem::AudioDecoding, metric);
    }
    if let Some(metric) = client_interval.next() {
        update_metrics(Subsystem::Client, metric);
    }
    if let Some(metric) = inference_interval.next() {
        update_metrics(Subsystem::Inference, metric);
    }
}
Into the much more compact:
pub fn run_collector(&self) {
    update_intervals(Subsystem::Routing, &self.route);
    update_intervals(Subsystem::AudioDecoding, &self.audio_decoding);
    update_intervals(Subsystem::Client, &self.client_receiver);
    update_intervals(Subsystem::Inference, &self.inference);
    update_intervals(Subsystem::Metrics, &self.metrics);
}
Stop Passing TaskMonitor Around!
In the implementation we currently make an AppMetricsEncoder for the entire application
and added this to axum as an extension. Then we extract out monitors and pass
them around. But we still need to use the Subsystem type in spawns for the
panic tracking.
We could use the Subsystem to get the TaskMonitor and not pass things around
and remove a lot of boilerplate that’s around all the spawns right now. This
works because our TaskMonitors are at the same resolution as our Subsystem.
This does means we need to access the StreamingMonitors type from within
spawn. To accomplish this I’ll make it a single global instance via a LazyLock
use std::sync::LazyLock;

pub static METRICS_HANDLE: LazyLock<AppMetricsEncoder> = LazyLock::new(AppMetricsEncoder::new);
Then I’ll pass the subsystem into spawn (and spawn_blocking), but this means
the counter now has to be gotten via the Subsystem. To make this easy I implement
a impl From<Subsystem> for Counter:
impl From<Subsystem> for Counter {
    fn from(val: Subsystem) -> Self {
        let name = val.name();
        counter!("total_task_panic_count", "task" => name)
    }
}
I’ll then rewrite the spawn function as follows:
#[must_use]
pub fn spawn<F>(future: F, subsystem: Subsystem) -> impl Future<Output = anyhow::Result<F::Output>>
where
    F: Future + Send + 'static,
    F::Output: Send + 'static,
{
    let current = Span::current();
    let monitor = METRICS_HANDLE.metrics.get_monitor(subsystem);
    let future = task::spawn(future).instrument(current);
    async move {
        let res = future.await;
        match res {
            Ok(v) => Ok(v),
            Err(e) => {
                let panic_inc: Counter = subsystem.into();
                panic_inc.increment(1);
                Err(anyhow::anyhow!(e))
            }
        }
    }
}
It should be noted if we use a let _ = spawn(async { panic!(); }, subsystem);
the panic won’t be tracked as the future is dropped and not polled. We’ve added
a must_use which will warn users but it’s still possible to lose our panic tracking.
I can now remove all the TaskMonitor::instrument calls from the rest of the
code and the AppMetricsEncoder extension from the axum Router. This also
changes the /metrics endpoint implementation to an equally small:
async fn get_metrics() -> Response {
    Response::new(METRICS_HANDLE.render().into())
}
Most of them time we should look at globals with an edge of suspicion and distrust. But in this instance it doesn’t make sense to have multiple metrics collectors, and reducing the number of arguments being passed around and amount of boilerplate is a net win.
Better spawn and spawn_blocking!
The tokio functions return a JoinHandle and we can create multiple of these
with different futures and store them in a vector. We can also call things like
abort.
Our code doesn’t need this right now, but it’s useful functionality that a lot
of applications need. And keeping the API looking the same makes it more
familiar to people who have used tokio before. To do this, we just make a
JoinHandle<T> that wraps tokio::task::JoinHandle<T> and includes our Counter.
use metrics::Counter;
use std::future::Future;
use std::pin::Pin;
use std::task::{ready, Context, Poll};

/// This type is a thin wrapper around a tokio join handle.
pub struct JoinHandle<T> {
    inner: task::JoinHandle<T>,
    panic_counter: Counter,
}

impl<T> JoinHandle<T> {
    pub fn abort(&self) {
        self.inner.abort()
    }
}

impl<T> Future for JoinHandle<T> {
    type Output = anyhow::Result<T>;

    fn poll(mut self: Pin<&mut Self>, cx: &mut Context<'_>) -> Poll<Self::Output> {
        let pinned = Pin::new(&mut self.inner);
        let res = ready!(pinned.poll(cx));
        let res = match res {
            Ok(v) => Ok(v),
            Err(e) => {
                self.panic_counter.increment(1);
                Err(anyhow::anyhow!(e))
            }
        };
        Poll::Ready(res)
    }
}
Oh, manually implementing a Future, suddenly we’ve taken a turn away from
beginner async Rust to a lower level. Let’s try and explain this code a bit
and we’ll see it’s not that hard.
Firstly, we need to implement Future for JoinHandle so we can await it in
the same way we do with our stored tokio::task::JoinHandle. Therefore, when
our future is polled we want to poll the Joinhandle. Future::poll takes a
Pin<&mut Self> meaning we want to make a pin of our inner JoinHandle so the
types match.
With that done, we poll the join handle, and if it’s not ready the ready!
macro will return the Poll::Pending otherwise it gives us our value. And with
the value we do our previous logic of incrementing the panic counter and
returning an error or the result.
This explanation is a bit brief, but the low level details of async Rust are a bit out of scope for us. If you want to learn more Amos (fasterthanline) has written a lot of useful resources. There’s also a lot more including talks and blogposts in the community which can be easily found.
But anyway, going back to our project, our spawn and spawn_blocking now look
like:
pub fn spawn<F>(future: F, subsystem: Subsystem) -> JoinHandle<F::Output>
where
    F: Future + Send + 'static,
    F::Output: Send + 'static,
{
    let monitor = METRICS_HANDLE.metrics.get_monitor(subsystem);
    let inner = task::spawn(TaskMonitor::instrument(&monitor, future.in_current_span()));
    JoinHandle {
        inner,
        panic_counter: subsystem.into(),
    }
}

pub fn spawn_blocking<F, R>(f: F, subsystem: Subsystem) -> JoinHandle<F::Output>
where
    F: FnOnce() -> R + Send + 'static,
    R: Send + 'static,
{
    let inner = task::spawn_blocking(f);
    JoinHandle {
        inner,
        panic_counter: subsystem.into(),
    }
}
There is one final detail you might want to change, in spawn I instrument the
future. This is because the tasks are spawned and awaited within one task.
Consider however this case:
#[tracing::instrument]
async fn background_task() {
    // Some other code
    let fut = async move {
        // Unimportant
    };
    task::spawn(fut, Subsystem::DoesntMatter)
}
Instrumenting this future fut when the task is first polled our tasks parent
Span might have already closed, and when the task completely it is most
definitely closed. So we can end up with a child span that starts and finishes
after it’s parent span is finished. Having such a level of detachment in a span
can be confusing and negatively impact things like any distributed tracing you
setup.
This isn’t a pattern we’re using in the code however, and distributed tracing things is a future entry! With those things in mind this is something to be aware of, and for your own applications you may want to have the user of the code handle the tracing spans themselves.
Dashboards
Right we have metrics, and it all comes out in some text endpoint. But the management yearn for graphs. They can’t understand them all, but they can at least look at the RTF ones and feel some semblance of reassurance at the number being low enough, or panic at it being too high.
For visualising metrics I usually go for Grafana. I’m always open to try newer easier to configure tools, however currently this one seems the easiest to configure to me. Grafana has some documentation on integrating with Prometheus.
We will need a Prometheus and Grafana instance running alongside our application. These have their own configuration files that are needed in order for Prometheus to scrape our metrics endpoint and Grafana to query Prometheus for our dashboards.
I’ve created a devops folder with prometheus and grafana subfolders to
store the config files. Starting with the Prometheus configuration, we’ll tell
Prometheus to scrape our service every 5s for metrics. This is relatively simple
and I honestly just grabbed it from the documentation so I recommend people go to
the docs to get the latest guidance. But here it is:
global:
  scrape_interval:     5s
  evaluation_interval: 5s
scrape_configs:
  - job_name: 'service-collector'
    static_configs:
      - targets: ["localhost:8080"]
This is assuming the server will be running locally at the default address for now. You can’t use env vars in this so the approaches are generally template and generate a config for a deployment or use some other service to provide service discovery. But as we’re just testing locally we’ll leave those decisions to whoever deploys this in production.
Now for Grafana let’s setup our data source - once again cribbing from the documentation:
apiVersion: 1
datasources:
  - name: Prometheus
    type: prometheus
    url: ${PROMETHEUS_ENDPOINT}
    access: proxy
    isDefault: true
We can use an env var here so I’ll just pop that in for now, but I will replace it with a hardcoded URL later. Because we’re going to make it so people can spin up everything without installing and running things locally!
How do we do this? I know some of you are getting a cold sweat right now as you see where this is going. That’s right Docker! I’ll use docker-compose to handle running the services to avoid people needing to install things themselves (aside from docker and docker-compose) to run this. The start of the docker-compose looks like so:
version: "2.2"
services:
  streamer-template:
    image: streamer-template
    ports:
      - "8080:8080"
# Devops supporting services!
  prometheus:
    image: prom/prometheus:v2.54.0
    ports:
      - 9090:9090
    volumes:
      - ./devops/prometheus:/etc/prometheus
      - prometheus-data:/prometheus
    command: --web.enable-lifecycle  --config.file=/etc/prometheus/prometheus.yml
  grafana:
    image: grafana/grafana:11.1.2
    environment:
      - GF_SECURITY_ADMIN_USER=admin
      - GF_SECURITY_ADMIN_PASSWORD=admin
      - GF_USERS_ALLOW_SIGN_UP=false
    ports:
        - "3000:3000"
    volumes:
      - ./devops/grafana/grafana_datasources.yml:/etc/grafana/provisioning/datasources/all.yaml
      - grafana-data:/var/lib/grafana
volumes:
  prometheus-data:
  grafana-data:
Note, if you’re using podman instead of docker you’ll want to append :Z to the
volume definition i.e. ./devops/prometheus:/etc/prometheus:Z to enable the
container to access the volume properly.
Using the DNS provided by Docker we can remove the prometheus endpoint URL and
replace it with http://prometheus:9090, we can also replace the localhost
streamer-template address with streamer-template:8080.
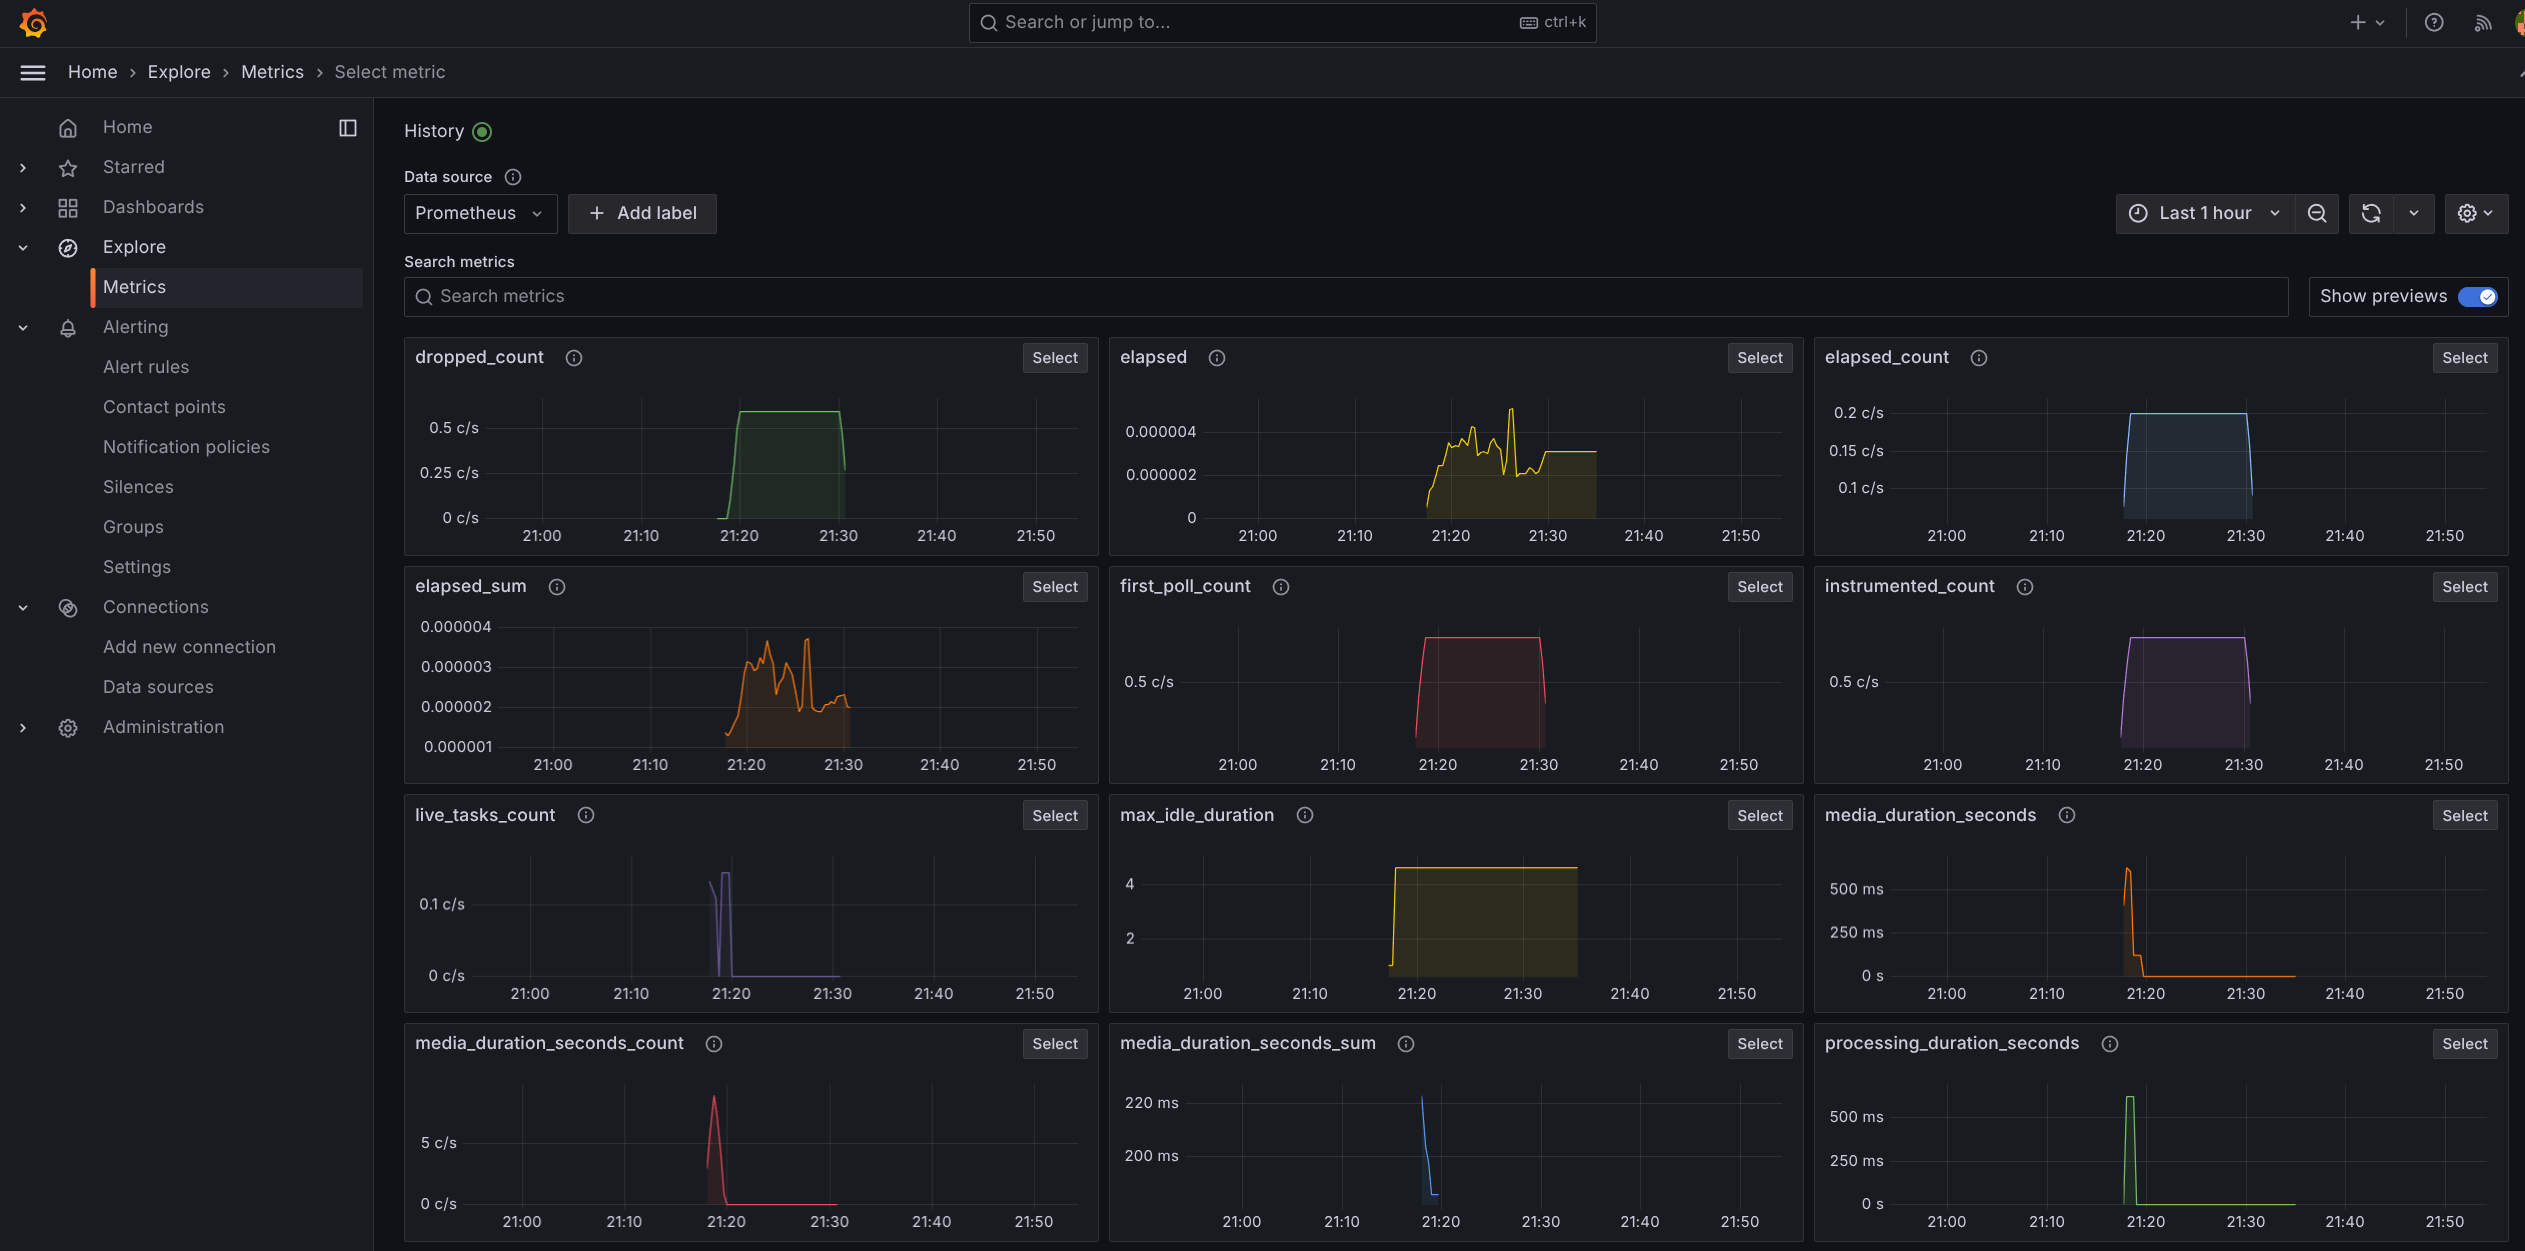
Now making dashboards is a bit out of the scope of this article - or at least I want it to be. Fortunately, there’s the “drilldown” view where you can explore all the metrics without needing to go through the hassle of making a dashboard.
If you go into Grafana and select Explore/Metrics you can find all the metrics present in a list of graphs. Consult the Grafana docs and you can see how to make dashboards or setup alerts on those metrics. I’ll just leave you with this screenshot taken after starting it up and running a file through it:
Conclusion
When adding things like metrics to code, a big concern can be how much visual noise it adds around the things we really care about. In this metrics code we’ve gone from the relatively unobtrusive panic tracking to a more visually disruptive task monitoring.
Tricks like RAII guards to collect related metrics or project specific spawns are great uses of abstraction to hide away this type of code. If we weren’t doing a streaming API but were doing a REST API we’d also look at tower middleware to collect API level metrics without disturbing the request handling code at all. But once again in the streaming world things like this are always a bit more fiddly.
In a future entry we’ll look at utilising some of these metrics to identify if some performance improvements have worked and show how they can be put to use in the real world.